(A Green Circle Capital White Paper)
by Bakley Smith, CFA, Director, and Stu Strumwasser, Managing Director, Green Circle Capital
December 2023 ©
Introduction
What is the cost of protein from various sources, animal, plant, or other? This topic has generated great discussion in recent years but remains murky and is also often the subject of biased attempts at persuasion by interest groups (rather than dispassionate analysis of the true comparable costs). Arriving at a fact-based understanding of these costs is more important than ever for both the food industry, and the human population more generally. For the purposes of this analysis, we establish two paradigms: Firstly, when we reference the cost of various types of protein, we are talking about ingredients, and not necessarily finished food products that are made from them. Secondly, while “plant-based meat” garnered a lot of media attention in recent years, there are a variety of other uses for non-animal proteins—and many people routinely eat unprocessed plants, many of which contain protein. However, if one is comparing the cost of plant-based meat analogues to actual animal meat, the analysis should include the cost of protein in plant-based meat as well as the cost of other ingredients (such as fats and flavors) and processing (such as extrusion, which can be expensive).
What Did We Learn?
Summary: While common perceptions seem to be that plant-based protein is somehow more expensive than animal-derived proteins, that is actually not true, particularly when one analyzes those costs on a “100% equivalent protein unit basis.” In the ensuing sections we define and measure the cost of protein from various sources, allowing us to show, for example, that protein derived from beef—on a 100% protein equivalent basis— is more expensive than all other examined proteins including all of the plant-based proteins we investigated. In contrast, soy protein on a 100% protein equivalent basis is significantly cheaper than all other protein sources we investigated. Pea protein lies somewhere in the middle, reasonably close to chicken but more expensive than soy protein.
However, the high costs of processing plant proteins for use in non-animal meat analogues continues to make many “plant-based meat” products prohibitively expensive to mainstream consumers. Whether that pricing dynamic changes in coming years will depend on the introduction of new production technologies to reduce the cost of, or replace, current methods such as extrusion, and/or the broad adoption of other proteins sources, such as mycelium, which may not require the same degree of downstream processing in order to deliver superior functionality, nutritional value, and flavor.
As readers may be aware, there is a looming crisis on the horizon as the world’s ability to produce food (and particularly, those foods rich in protein) using current production methodologies leading to what might become a limiting factor of the projected population growth in the next few decades. The United Nations Department of Economic and Social Affairs expects, “The current world population of 7.6 billion (as of 2017)… to reach 8.6 billion in 2030, and 9.8 billion in 2050,” 1 The World Resources Institute stated, “The difference between the amount of food produced in 2010 and the amount necessary to meet likely demand in 2050 … [indicate that] 56 percent more crop calories [will be needed] than were produced in 2010.” The way that we make food must therefore change, and the sources from which we derive protein need to become more diversified and efficient.
In recent years there has also been a great deal of discussion (and confusion) in the food and foodtech industries about “price parity” in regard to protein sources from alternative to animals. In the foodtech and plant-based meat segments it seems to be generally understood that making a plant-based “burger” or “chicken nugget” analogue using proteins from plants or other non-animal sources may cost more than one made from animal meat due to the high cost of other necessary ingredients and downstream processes (such as various types of extrusion). Comparing the price of one finished food product such as a burger (made from animal meat) versus another (made from non-animal ingredients) seems to be reasonable and simple. However, we are often drawn into discussion about “price parity” between B2B ingredients such as protein isolates made from peas or algae, and a piece of beef. The former is not a finished good that can be consumed until further processed, but the latter is vastly lower in protein content on an equal weight basis. Yet, we frequently hear those mis-aligned comparisons drawn by foodtech startup CEOs, fellow investors, and professionals throughout the food industry. There is also a myriad of other uses for protein derived from non-animal sources that have nothing to do with plant-based meat. That includes segments such as protein shakes, supplements, baked goods, pasta, cheese, etc., which may not require expensive processing such as extrusion. There are also numerous other valuable nutritional components in plant-based food (such as fiber) beyond just protein. That said, protein remains a fundamental food component and understanding its costs, when derived from different sources, is important. In our work investing in technologies that disrupt the manner in which we make and/or distribute food we searched for a single, unbiased and practical guide comparing the costs of some common protein sources, using a standard measure of unit—and we were unable to find one. So, we thought we’d invent our own and share it.
Section I: What Are Different Protein Sources?
The Good Food Institute defines “alternative proteins” as, “proteins produced from plants or animal cells, or by way of fermentation. These innovative foods are designed to taste the same as or better than conventional animal products while costing the same or less. 2” It is interesting that GFI (perhaps the leading repository of information supporting the adoption of such products and the elimination of animals from the food supply system) considers protein from plants as something “alternative” (whereas we do not). GFI also goes on to apply quantitative and qualitative guiderails (regarding taste and cost) to define what might be “alternative protein.” In common parlance, we think it has become generally accepted that “alternative protein” means “protein from plants, fermentations, mycelium and the like” as compared to “protein from animals” which is considered “traditional” protein. Whether various types of protein might be characterized as “alternative” or otherwise is not the point of this analysis. Rather, we aim to simply define and clarify what those various types of protein cost. This paper compares the cost of proteins derived from various animal and plant sources.
The use of animal-derived proteins as food staples in western diets has been standard for a very long time. Animal meat and dairy products have long been regarded as the primary sources of protein in Europe and North America. A 2015 report from Stefan Pasiakos, director of the National Institute of Health’s Office of Dietary Supplements (ODS), et. al. indicates that 62% of protein intake comes from animal or dairy, 30% comes from plants, 8% was unclassified 3. A separate report from Menus of Change, a joint program by the Culinary Institute of America and the Harvard T.H. Chan School of Public Health, put that number at 85% of protein in the American diet coming from animals 4. The situation is similar in Europe where a 2013 article in The Journal of Nutrition found that 55-73% of protein consumed in 10 European countries came from animals. In addition, as the emerging middle classes in countries like China and India can now afford animal meat, global demand has skyrocketed.
Yet, animals are not the real initial sources of protein but are really just processors of it. Cows and chickens eat plants which have proteins that are then processed (quite inefficiently) into the protein many think of as “traditional.” These animal-derived proteins have grown as a share of total protein consumed by humans, especially in western societies, as people have increased their consumption of meat over time. When one refers to plant-based proteins as “alternative,” this fundamental relationship between plants and the proteins that find their way into animal-derived protein products is overlooked.
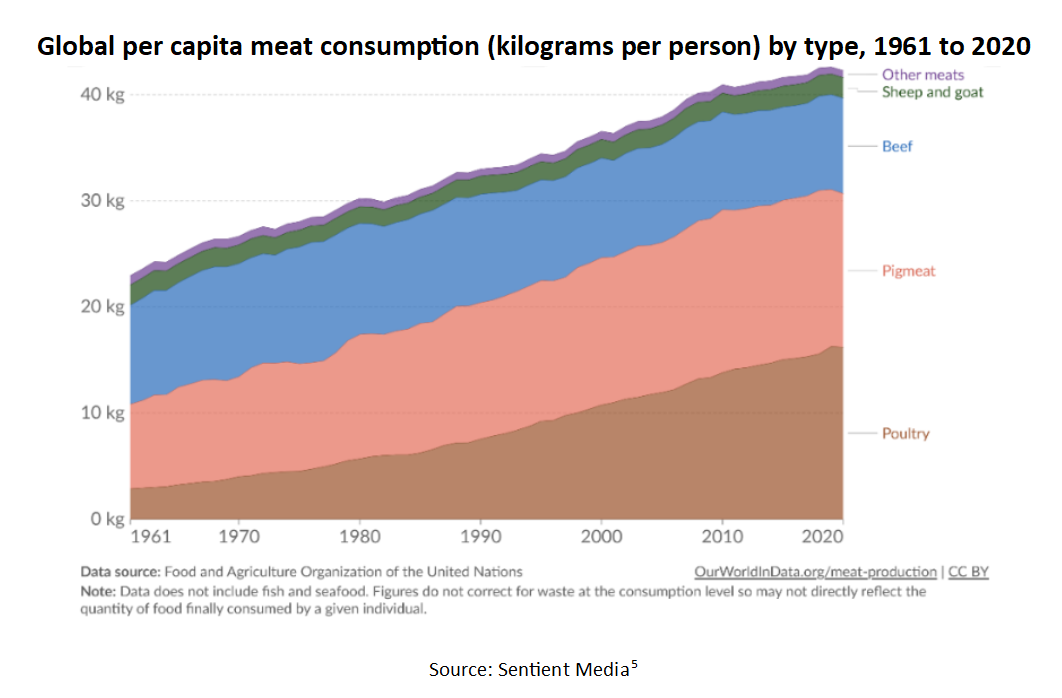
As the global population continues to grow and demands more meat in its diet (as evidenced by the graph above), the challenge of producing ample animal protein to meet rising demand becomes more daunting given the limitations of key resources like energy, land, and water. Modern, conventional animal agriculture, which relies on expansive areas of land and significant water usage, is becoming less sustainable in the face of these resource constraints. The inefficiency of converting plant-based inputs into animal protein outputs exacerbates this problem. To feed a growing population in a world with limited resources humans will likely need to utilize more efficient sources of protein, including more direct consumption of plants.
Section II: Establishing Price Comparability
Protein comes in many forms and making an apples-to-apples (or apples-to-cows) comparison of the cost of different proteins is inherently difficult. For this exercise, we distinguish and compare the cost of different proteins sold to food manufacturers at wholesale pricing. This means we are looking at the costs of a kilogram of butchered meat and not the farm price of an animal. It is reasonable to compare the cost of a steak or a chicken breast to soybeans or peas, but not to soy or pea protein isolate. Additionally, bulk purchasing, like that done by food producers, impacts price and so purchase volume is a factor to consider when comparing prices (when possible, we use prices based upon one metric ton or 1000 kilograms). Herein we establish a more granular understanding of pricing dynamics, ensuring that our comparisons are not only standardized but also relevant.
Whatever the source material might be, we then “adjust” for the percentage of the material that is actually protein (as opposed to water, fats, or other component materials). For all of these materials, we then attempt to create comparable pricing based upon a kilogram of pure protein derived from various raw material sources, or what we call, “protein equivalent unit pricing.” For further clarity, we are not attempting to compare prices for food products or “finished goods” but rather, create a valid comparison for the cost of the proteins contained within them—understanding that some are ready for consumption and other require processing which implies additional costs.
Establishing the Cost of a Nutritionally Equivalent Unit of Protein
Hamburger meat contains between 17% and 20% protein, 10-20% fat and 60-70% water and other components. Most pea protein powder is 70-90% concentrated protein. To make a proper comparison between the cost of protein from these two sources, one should compare hamburger meat and raw peas—or adjust the price of material derived from each as if it were 100% protein. (In simple terms, and for illustrative purposes, if protein from one source that costs $10/Kg is 20% of the material, and protein from another source that costs $10/Kg is 80% of the material, the true cost of “protein” derived from the first one is actually four times that of the latter.)
Finally, certain adjustments were made for PDCAAS (Protein Digestibility Corrected Amino Acid Score, a method used to evaluate protein digestibility based on both the amino acid requirements of humans and their ability to digest those amino acids in a given food). Notably, PDCAAS has been criticized in recent years for its limited utility because the scale, which ranks all proteins between 0 and 1, truncates those at the top thereby limiting the apparent superior digestibility of certain proteins at the top of the scale, (mostly animal proteins, such as those derived from milk or eggs). A new measurement for protein digestibility, DIAAS (Digestible Indispensable Amino Acid Score) has become utilized by some in recent years but trying to adjust all protein prices for DIAAS would introduce further analytical complexities and challenges, as it would be necessary to consider the combination of various protein sources as components of larger meals. As such, we have omitted minor adjustments for digestibility that might be needed for any protein source with a PDCAAS over .9 (including most animal proteins, soy, etc.) but we have adjusted upward the “protein equivalent unit pricing” of peas and chickpeas (with PDCAAS of roughly .85) by 17.6%, and of wheat protein (with a PDCAAS of roughly .45) by 122%. For a more complete explanation of our implementation of adjustments for PDCAAS please see the notes on Methodology at the end of this paper.
Lastly, while we did not attempt to assess the cost of processing (due to the very large universe of different protein ingredient sources, formulations and finished good formats, etc.) many meat products and plant protein isolates require processing before they can be consumed—but the costs incurred to achieve functionality (such as taste, solubility, and emulsification) can vary dramatically. To imbibe protein from cauliflower, one need only eat the plant. For meat, it is usually simple and inexpensive butchering or grinding and then cooking. Conversely, while some uses of plant protein isolates do not require expensive processing, plant-based meats usually require the use of some form of extrusion.
Indeed, for some formats (such as plant-based meat) plant-derived protein isolates often require significant and expensive processing to be palatable.6
Section III: So What Are the Costs of Comparable Proteins?
Our investigation reveals that the cost of animal-derived protein is higher than sometimes believed (versus plant proteins) once we adjust for the cost of protein purity. In fact, while one rap on plant-based protein is that it is too expensive, our work suggests that is not the case (or, at a minimum, is more attributable to the processing costs of certain products).
Animals
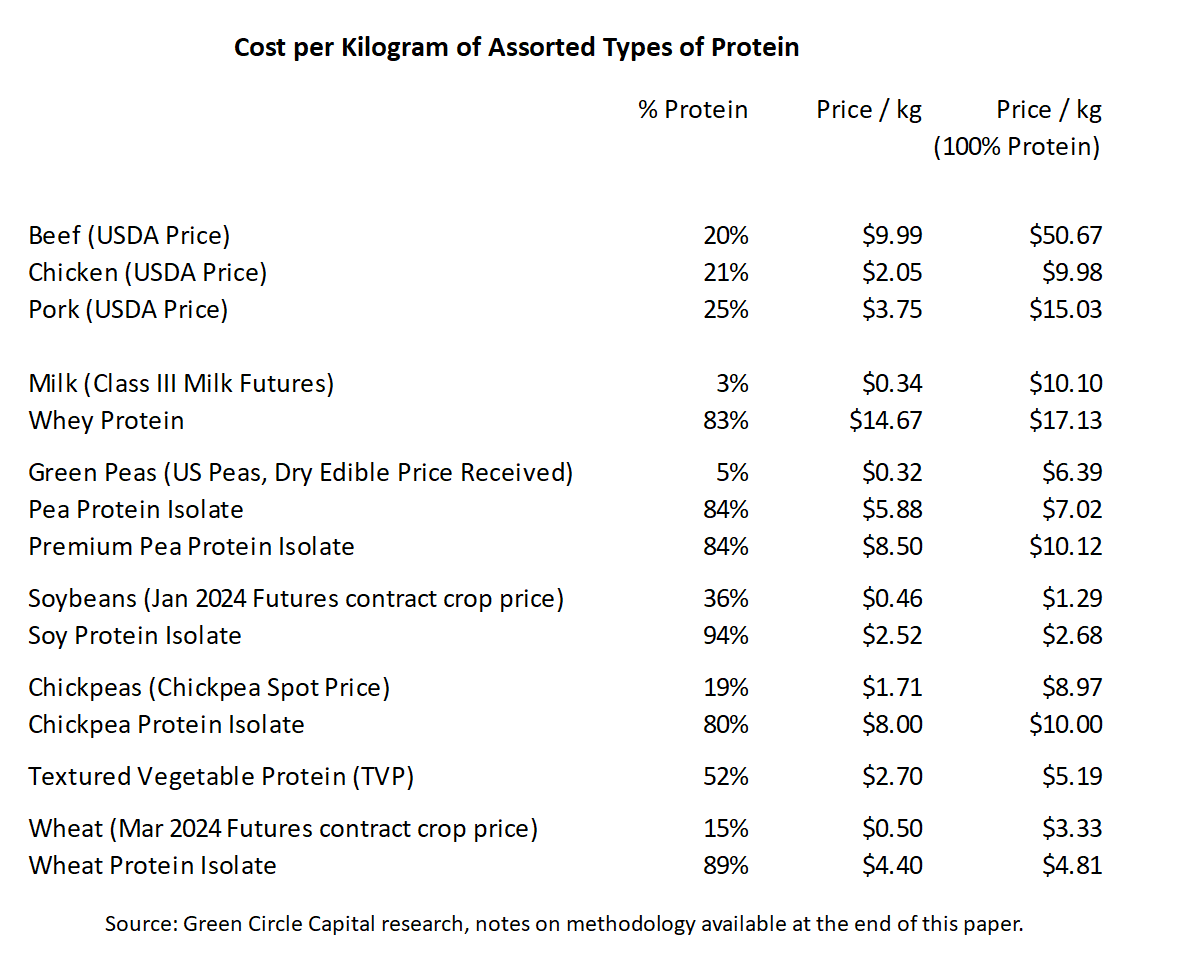
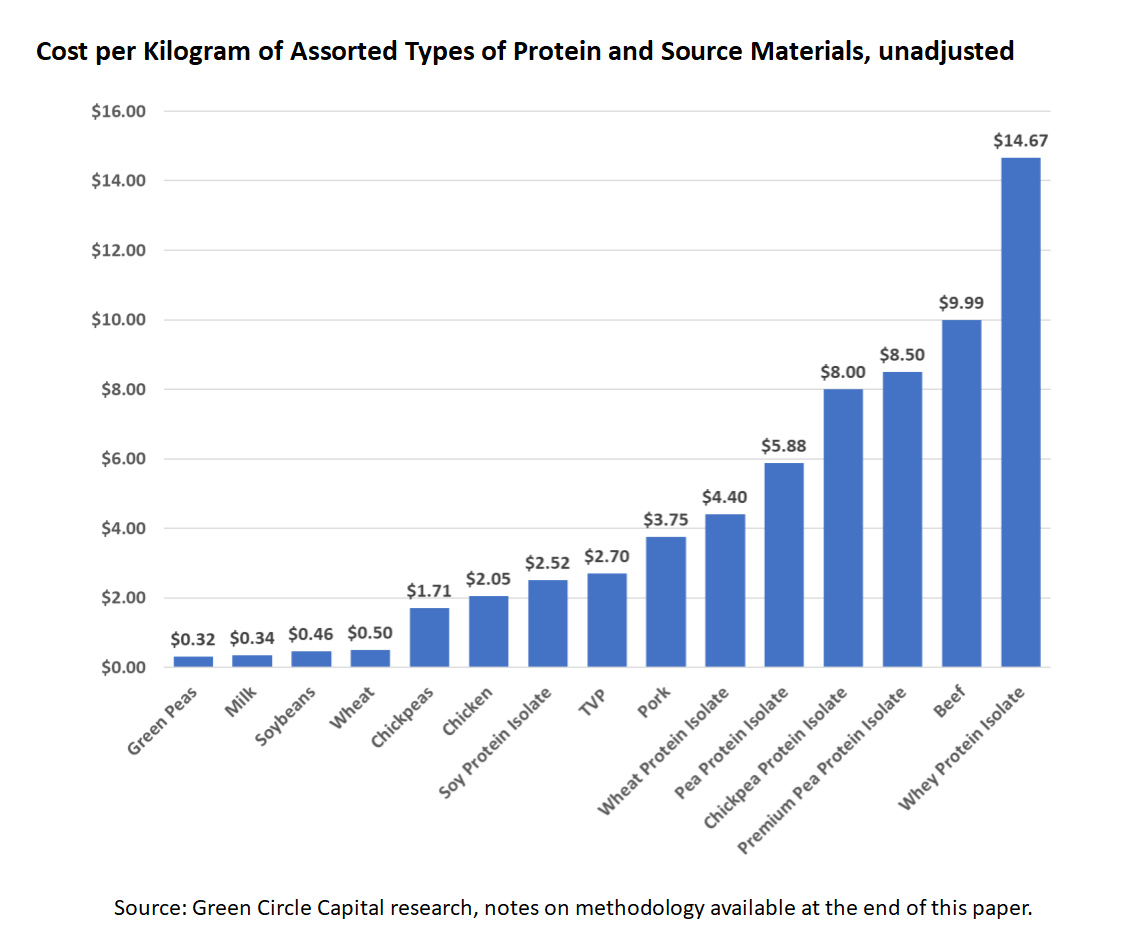
We used publicly available data from the United States Department of Agriculture to track the wholesale cost of animal meat (beef, chicken, and pork). We found that the cost per kilogram of these items is low with beef at $9.99, pork at $3.75 and chicken at $2.05. These products, however, are only about 20% protein with 75-80% water, fat and other elements 7. When we adjust to focus only on protein, the cost goes up considerably, to over $50 per kilo of protein from beef.
Fluid milk has a lower protein content, at around 3.5% and it is also quite low-priced per kilogram at around $0.34, according to recent futures prices from CME Group (formerly the Chicago Mercantile Exchange). Whey protein concentrate, derived from milk, however, is typically very high in protein content (averaging 83% in our survey) and considerably more expensive at $14.67 per kilogram according to an average of available wholesale prices in a quantity of one metric ton (1,000 kilograms). On a 100% equivalent basis, the whey protein in our sample cost $17.13, 70% higher than chicken and 13% higher than pork, although still well below the equivalent beef price.
Plants
Protein derived directly from plants is generally much cheaper than that derived from animals, especially when compared on an equivalent, 100% protein content basis. Soybean-derived protein is the cost winner at around $0.46 per kilogram for the commodity soybean product, based upon recent futures prices provided by CME Group. Soy protein isolate, which averages around 95% protein, costs $2.52 per kilogram or $2.68 per kilogram on an equivalent 100% protein basis, according to our survey (methodology described below). Soy-derived products come with some important drawbacks, most notably that soy is an allergen for a small but not insignificant portion of the population 8, that it brings an off-putting taste to some people 9, and that in powder form it is considered a heavily processed food often with genetically modified inputs 10. Textured vegetable protein or TVP typically refers to a soy-based product and we found in our research that it tracks right between soybeans and soy protein isolate.
Green peas and pea protein are on the higher end of our plant-derived proteins in terms of cost. Green peas, which do not have a futures contract traded on the CME, cost around $0.32 per kilogram. Low-end pea protein isolate sourced from China, at around 84% average protein content, costs roughly $5.88 per kilogram, before the additional cost of shipping (in December 2023). Premium pea protein ingredients manufactured in the US or Europe cost as much as $2-3 dollars more per kilogram. On a 100% protein equivalent basis, low-end pea protein costs $7.02, according to our survey. This puts a protein source commonly considered to be very expensive at a 30% discount to chicken, a 46% discount to pork and an 86% discount to beef (before the cost of extrusion or other processing). Even the most premium pea protein costs about the same as chicken on a protein equivalent basis and is less expensive than pork or beef.
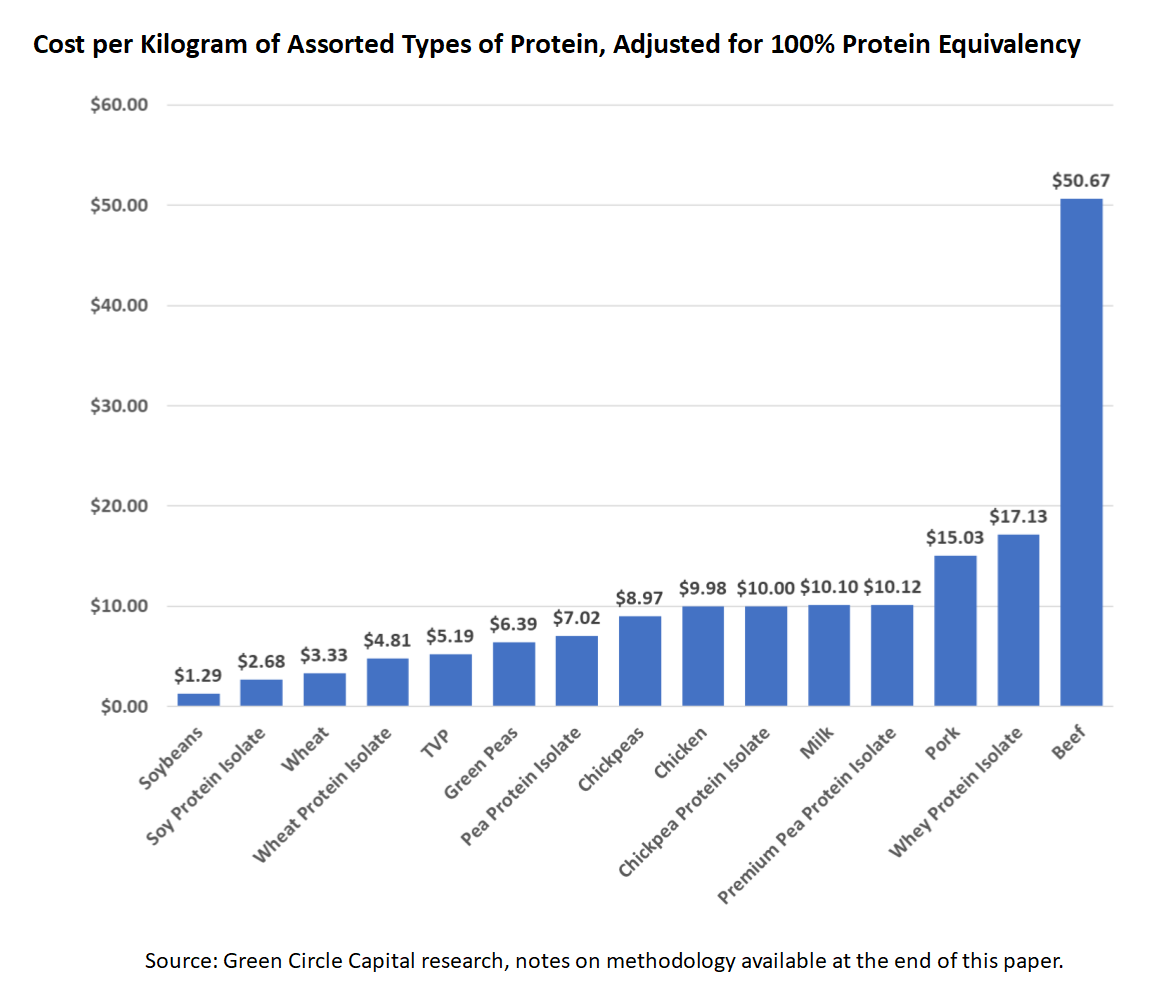
Chickpeas and chickpea protein are the highest priced plant-based products in our survey. Chickpeas do not have a futures contract traded on the CME but our research indicates that a kilo of chickpeas costs about $1.71 which equates to $8.97 on a 100% equivalent protein basis. Chickpea powder, at 80% protein content, is $8.00 and $10.00 on a 100% equivalent protein basis. While more than soy protein and pea protein, chickpea protein is at parity with chicken on a 100% protein basis and at a 33% discount to pork and an 80% discount to beef.
Wheat is a lower cost protein source with wheat futures priced near soybeans and wheat protein isolate at $4.81 per kilo, 80% more than soy protein isolate, but 12% less than pea protein isolate, on a 100% equivalency basis. Wheat futures are traded on the CME and price at about 50% of soybeans per kilo at $0.50, for the near-dated contract. However, wheat protein is a far less digestible protein according to PDCAAAS or DIAAS.
What about Mycelium?
Green Circle believes that in the years and decades to come mycelium may become a common and important input for food products consumed by humans. Mycelium can be manufactured using a fraction of the land and water required for farming animals. Unlike pea or soy protein isolates, mycelium can be made as a whole food that is not fractionated. Mycelium can also more closely mimic the texture and functionality of animal meat without the need for extrusion or other expensive downstream processing. We look forward to including pricing on mycelium in the future but as of today the mass manufacturing of this ingredient remains a nascent industry without reliable or standardized pricing.
Section IV: Why Does It All Matter?
The environmental damage done by greenhouse gas emissions and other effects of industrial farming is a separate-but-related issue, but further supports the need for new and more efficient ways to produce protein and feed future generations. This conundrum is the fundamental thesis driving the creation and growth of the foodtech ecosystem wherein a myriad of startups, scientists, investors, and partners at food companies are working to combat that problem. It is also common knowledge to many in the broader food and beverage industries who do not specifically work on new technologies and processes, but do interact or partner with people, products and companies that do so. Even many in the mainstream public with no scientific background or professional relationship to the food industry are aware, or even concerned, about this issue, and they have varying degrees of information.
One simple way to minimize that gap would be a net global migration to consumption of more plant-based foods and less consumption of animal meat. According to a paper published by Peter Alexander of the School of Geosciences, University of Edinburgh, et. Al., the protein efficiency of beef is 3.8%. This means it takes roughly 100 grams of protein from plants fed to a cow to create four grams of edible protein for humans 11. It would be vastly more efficient to simply feed the plants to the people and cut out the middlemen (i.e. the cows). However, while we have witnessed increased adoption of plant proteins in developed nations in recent years (including by “flexitarian” meat eaters), meat consumption per capita remains high and is augmented globally by the growth of meat consumption from the emerging middle classes in large, developing nations such as China and India. Many of those hundreds of millions of new members of the global middle class demand meat in their diets, like their western counterparts. To mitigate the protein gap in the context of these trends will likely require a suite of solutions including more efficient means of farming animals, reduction of food waste at numerous intervals along the food supply chain, broader adoption and use of protein from plants and other sources (and more efficient methods for producing them), and an expanded portfolio of ingredients and finished goods manufactured from them.
When it comes to food, taste is paramount. While a very small portion of the population of western countries identifies as vegan and will simply not consume any animal protein, most consumers do not maintain a rigid view about avoiding animal proteins. Even many folks who identify as flexitarian and seek to minimize their consumption of animal meat prefer the taste and texture of animal meat products and the recent retracement in the adoption of vegan products among non-vegans is evidentiary of this fact. Plant-based meat analogues are often inferior in taste and texture.
After taste, the key drivers for consumers when it comes to food products are cost and convenience. A widespread and confused debate has evolved in the foodtech and alternative protein circles about getting to “price parity” with animal protein, which is the subject of this paper. Over the last few years we have frequently found information purporting to provide a “cost comparison” between two or more protein sources to be mis-stated, incomplete, or downright incorrect. Specifically, for illustrative purposes, comparing the cost of a kilogram of beef, which might be roughly 20% protein, to a plant-based protein isolate which is 80% pure protein, may not make sense.
Section V: Conclusions
While common perceptions seem to be that plant-based protein is somehow more expensive than animal-derived proteins, that is actually not true, particularly when one analyzes those costs on a 100% equivalent protein unit basis. Clear conclusions are not easy to draw given the compositional complexity of animal meat and the broad variety of types and formats, the need for downstream processing of most plant proteins (for use in plant-based meat) and the value placed on taste and texture which are captured in the price of certain protein-rich food products but are not actually directly related to the protein content. One must buy a lot of non-protein components of the meat to get the animal protein.
The notion that plant proteins cost more than those derived from animal meat has become pervasive, perhaps with the popularization of so-called “plant-based meats” by Beyond and Impossible in recent years. While Beyond and Impossible burgers do, in fact, cost more than beef hamburgers, it is not because of the cost of the protein ingredients (which is clear from a glance at the price comparison chart displayed earlier in this piece). The high costs of those products were driven by the use of protein isolates (extracted from peas or soybeans) that require “ultra processing” such as the employment of expensive extrusion to perform as desired, in that format. The costs were also driven by the effect of limited scale on production and distribution expenses, and, to a lesser degree, the extensive ingredient decks in the formulations of those highly-processed foods, some with more than twenty different listed ingredients. Lastly, significant investment in the marketing, advertising, merchandising and promotion of products from those brands also contributed to their high price points. For consumers who are not seeking a non-animal food product that tastes and performs like animal meat and might eat, for example, a black bean burger or veggie burger, they can purchase a product high in protein at a lower cost right now. For consumers seeking the taste and texture of animal meat, with a cleaner label and at a lower price, that may soon be on the way.
The point is that it is not the price of plant-based proteins that has led to higher prices in recently popularized plant-based products, but rather the cost of other items that can be addressed and perhaps lowered as the market matures. For instance, next generation meat analogues may be developed using ingredients like mycelium to provide protein. As a whole food that is not fractionated, the use of mycelium (and other ingredients being developed) may soon enable the production of meat analogues that more closely resemble the taste and texture of animal meat and do so with shorter, cleaner ingredients labels, and without the need for expensive downstream processing such as extrusion. As new technologies are developed to affect the performance and utility of common non-animal proteins, implemented at greater scale, and new protein ingredients are developed from entirely new sources that are broadly adopted by consumers, that perception may change. We intend to update this piece and distribute it with an addendum, annually. We hope that you find it to be helpful. If you have data to add or suggestions for edits to future versions, please get in touch and let us know.
Notes on Methodology:
- Beef, Chicken and Pork prices are reported by the USDA using its Economic Research Service (ERS) calculations. Prices are given by pound Green Circle converts those prices to kilograms for comparability. Additional information is available at https://www.ers.usda.gov/data-products/meat-price-spreads/
- Milk and Soybean prices are for the most actively traded futures contract on November 14, 2023 listed on the CME Group (Chicago Mercantile Exchange) website. Additional information available at https://www.cmegroup.com/markets/agriculture.html#products
- Green peas prices are taken from Y Charts internet-based information service. Additional information available here https://ycharts.com/indicators/us_peas_dry_edible_price_received
- Prices for chickpeas, whey, pea, soy and chickpea protein are averages of prices for wholesale shipments of those products from suppliers listed on Alibaba. The quantity purchased is 1000 kilograms, or one metric ton. The prices are quoted without shipping costs.
- Adjusting for PDCAAS (and not DIAAS) for certain protein sources with a PDCAAS of less than .9:
The NIH’s National Library Of Medicine “{nutrition Reviews” journal article, Wolfe, Rutherfurd, Et Al, https://www.ncbi.nlm.nih.gov/pmc/articles/PMC6322793/
“Dietary guidelines specify that the requirement for protein should be met through the intake of “high-quality” protein.1 The definition of “high-quality protein,” however, is vague. Consequently, it may be useful in a number of circumstances to consider the ability of a diet to meet the requirements for all of the dietary indispensable amino acids (IAAs), rather than total protein. This approach requires quantifying protein quality in terms of the extent to which ingestion of a certain amount of protein delivers the target intakes of the IAAs. The Food and Agriculture Organization of the United Nations (FAO) developed an approach to quantifying protein quality called the Protein Digestibility–Corrected Amino Acid Score (PDCAAS)…. A PDCAAS of 1 means that all of the minimal requirements for IAA intake would be met if the amount of the test protein eaten was equivalent to the estimated average requirement (EAR) for protein. For high-quality proteins that have a PDCAAS greater than 1.0, the PDCAAS truncates scores to 1.0. Truncation is used since it was deemed that excess dietary amino acids would not be utilized and therefore should not be included in the PDCAAS values.”
PDCAAS has been criticized in recent years for limitations such as the truncation of all protein values greater than 1. Many animal-derived proteins (such as milk and eggs) would score substantially higher than 1, and the disparity in protein digestibility and quality—and thus, value—(versus plant proteins) would be more clear—and more substantial—were it not for the truncating methodology utilized in assigning PDCAAS values.
“The FAO recently released a document recommending the adoption of a new scoring system to quantify dietary protein quality.3 The new scoring system, termed the Digestible Indispensable Amino Acid Score (DIAAS), is meant to replace the PDCAAS. The conceptual goal of the DIAAS is similar to that of the PDCAAS. With the DIAAS, the quality of a protein is based on the relative digestible content of the IAAs and the amino acid requirement pattern. In contrast to the PDCAAS, the DIAAS is not truncated for a single-source protein, thereby theoretically enabling the ranking of all dietary proteins by their quality. An accurate quantitative ranking of protein quality has great potential for clarifying many aspects of protein nutrition in a general sense, and could be of value specifically in the context of dietary recommendations and the creation of meal plans. The accuracy of the DIAAS is contingent on a variety of factors, including the use of the content and profile of IAAs as the basis for the calculation of quality; the methods for the determination of the protein and amino acid content of the protein source; the accuracy of individual requirement values for IAAs; the normalization of IAA requirements by dividing each value by EAR for protein, and the use of the true ileal digestibility of each IAA in the test protein as the basis for the DIAAS. In light of the many and varied potential applications of the DIAAS, it is pertinent to review the factors underlying the calculation of the DIAAS for individual proteins.”
While DIAAS may, in some ways, be more accurate than PDCAAS, it is also more complex. DIAAS calculations acknowledge that the combination of proteins from different sources, such as milk and wheat, in one meal, affect digestibility and the value of the component proteins. For the purposes of this paper, to try and assess the cost and values if various individual proteins derived from various sources, utilizing DIAAS rather than PDCAAS might ultimately diminish the value and accuracy of our conclusions rather than enhance them. One thing is very clear: proteins from different sources have different digestibility factors and that must be considered into any assessment of the value of such proteins, and their “protein equivalent unit” cost. For this paper we have chosen to adjust the protein equivalent unit prices of all sources of protein with a PDCAAS of less than .9, by accounting for the lower PDCAAS. Thus, for pea protein, which has a PDCAAS of roughly .85, we have added 17.6% to the cost (thus equating the price as if the PDCAAS was 1). For whole wheat protein, which has a much lower PDCAAS of roughly .45, we have adjusted the price upward by 122% (again, to make the price equivalent as if the PDCAAS was 1.)
For further information, please contact the authors:
If you would like to send this whitepaper to a CEO or other friend, please enter the brief information below:
- “2017 Revision of World Population Prospects,” United Nations Department of Economic and Social Affairs, https://www.un.org/en/desa/world-population-projected-reach-98-billion-2050-and-112-billion-2100 ↩︎
- The Good Food Institute: “What Are Alternative Proteins?” https://gfi.org/defining-alternative-protein/ ↩︎
- Pasiakos et al “Sources and Amounts of Animal, Dairy, and Plant Protein Intake of US Adults in 2007–2010” National Institute of Health. https://www.ncbi.nlm.nih.gov/pmc/articles/PMC4555161/ ↩︎
- Anonymous, “Protein Consumption and Production,” Menus of Change https://www.menusofchange.org/issue-briefs/protein-consumption#:~:text=The%20average%20American%20adult%20man,percent%20of%20this%20dietary%20protein ↩︎
- Sentient Media: “Meat Consumption in the U.S. Is Growing at an Alarming Rate,” 2021 https://sentientmedia.org/meat-consumption-in-the-us/#:~:text=Pork,pounds%20of%20pork%20per%20capita ↩︎
- Journal of Food Engineering, “High moisture extrusion cooking of pea protein isolates: Raw material characteristics, extruder responses, and texture properties,” https://doi.org/10.1016/j.jfoodeng.2013.11.023 ↩︎
- Protein content taken from assorted commonly available references, mostly Google’s food calculator which is available with searches like “how much protein is available in a hamburger?” Google sites the USDA as the source of information. ↩︎
- Thermo Fisher Diagnostic Education, https://www.thermofisher.com/diagnostic-education/hcp/us/en/allergy/food-allergies-diagnosis-treatment/soy-allergy-diagnosis-treatment.html ↩︎
- Critical Reviews in Food Science and Nutrition https://www.tandfonline.com/doi/epdf/10.1080/10408398809527487?needAccess=true ↩︎
- Scripps, “Is Soy Healthy” https://www.scripps.org/news_items/5268-is-soy-healthy ↩︎
- Alexander et al. (2016), University of Edinburgh. “Human appropriation of land for food: the role of diet. Global Environmental Change” https://ourworldindata.org/grapher/protein-efficiency-of-meat-and-dairy-production ↩︎