Better-for-You Pasta—Renewing Growth for The Category, July 2018
(A Green Circle White Paper)
Pasta is a large category.
According to business intelligence firm Euromonitor and the Canadian International Department of Agriculture[1], the US pasta market was valued at $3.6 billion in 2016. Growth in the pasta market had been strong over the last 25 years with a compound annual growth rate of roughly 4% between 1990 and 2016, according to a research report by IMARC group[2] and a 1991 report cited in a New York Times article. Business consultants at IMARC explain how the category has traditionally benefitted from its convenience and taste profile, and it was long considered “on trend” for both restaurants and at home consumption. However, changes in consumer tastes, driven by perceived benefits of reducing carbohydrates, and the rise of alternative grain options like quinoa has led to a rather sharp slow down in the overall category in both the United States and in key markets in Europe.
Better-For-You pasta is where the real growth is.
The alternative pasta category has grown to over $250 million in the United States from an estimated $75-$100 million in 2010 (according to SPINS, Information Resources, Inc., Mintel and Green Circle Capital estimates) indicating a blistering compounded annual growth rate of somewhere between perhaps 12% and 18%. We define the category as protein pasta made from beans and gluten-free pasta. The growth has been driven by health-consciousness and the perceived benefits of lowering carbohydrate and gluten intake and increasing the protein content in meals. The term “Plant-Based” is absolutely on trend in 2018 and most gluten-free pastas make that claim.
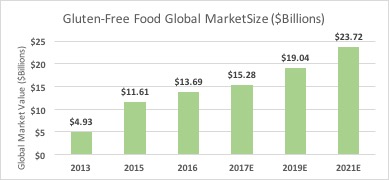
The growth in better-for-you pasta is part of a larger trend toward higher protein foods which has been affecting the market for approximately ten years and is expected to continue, per a recent CNBC report and Mintel Research[3]. Euromonitor and others have noted the description of traditional grains as “high protein alternatives” over the last few years. A related category is gluten-free food which was valued at $13.7 billion in 2016, according to market research firm Mintel[4]. Growth in gluten free has been rapid, up about 300% since 2013, and we see a similar trend taking hold in the high-protein alternatives to traditional meat-based protein sources.
Global gluten-free food market size from 2013 to 2021 (in billions of U.S Dollars).
Indeed, the same general trends affecting the food market in other categories are at work in better-for-you pasta. Growth in health consciousness, resistance to mega brands, and health condition-based diet customization are big drivers. Consumer have shifted their focus from brand loyalty and attribution to a more nuanced and independent thought process. Many consumers, especially younger ones, prefer smaller companies with niche products. This largely is the case in BFY pasta, where the majority of sales (despite recent expansion into mainstream outlets like Costco and Walmart) are still generated in the natural channel.
US and global growth in traditional pasta has slowed in recent years.
The slowdown in pasta in the US has been relatively severe with growth slowing to 1.8% since 2010. Other key markets like Germany, the United Kingdom and even Italy have seen similar or more severe slowing according to a CNBC report[7] and an executive at a growing pasta brand. Consumer research outfit, Euromonitor, says that higher protein foods continue to attract consumers in the packaged food space, putting pressure on overall growth rates in products based on rice, pasta and noodles. Indeed, the growth in the pasta category has come largely from alternative pastas. This trend began with the emergence of gluten free, rice-based pastas and now is led by bean-based, protein-rich pastas. Whole wheat pasta also remains an alternative to traditional semolina pasta.
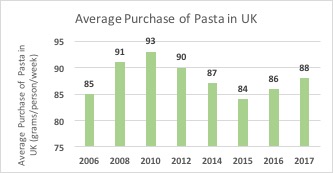
Stagnant Growth in Pasta in the United Kingdom
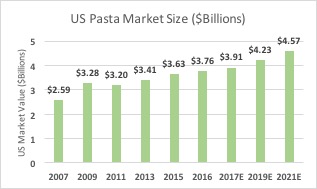
Pasta Market Size in the United States of America from 2007 to 2021 (in billions of U.S Dollars)
There is still growth on a global basis, particularly in emerging markets.
Despite the notable issues in the established markets, the category is growing globally. Many have the impression that the pasta industry is in a state of decline given the headwinds it faces (perceived issues around gluten, a move away from carbohydrate-heavy foods, and even the declining interest in Italian food[9]). According to Research and Markets, there is a global preference for enhanced convenience and low-cost options for food. Pasta, despite these noted issues, is a highly convenient and tasty meal and the category is still growing quite nicely on a global basis with a compounded annual growth rate of 4% from 2010 until 2017[10]. Furthermore, according to Euromonitor, the pasta category in developing markets such as Egypt, Turkey, and Iran is expected to continue to enjoy growth of around 4% between 2016 and 2021[11].
Total Market Value of Pasta in International Countries in 2017
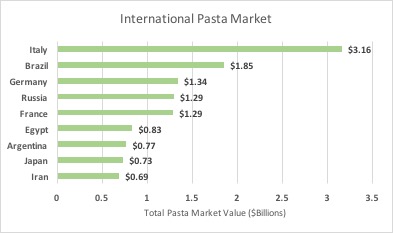
Source: Based on a report on the international pasta market conducted by Euromonitor [12]
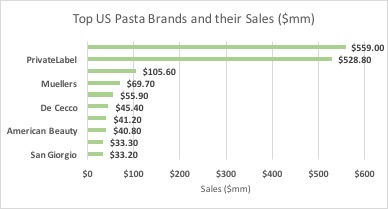
Growth in private label pasta offerings. Another notable change is the move to private label, especially in Europe. In the UK, it accounts for over half of the market according to Euromonitor data. This could mean that retailers will take a heightened interest in higher-value protein pastas to support category growth given the revenue impact from a significant shift to private label.
Leading Pasta Brands in the United States ($mm)
The broader picture on carbohydrate-heavy foods.
We took a holistic look at other grain/staples broadly in the same dietary category as pasta, including potatoes and rice, and we found that consumption of all such traditional products is either experiencing stagnant growth or declining in the United States. What we see is a scattering of what was formerly a relatively small set of choices. According to data from the US Department of Agriculture, provided by Statista, the per capita consumption of fresh potatoes has decreased from 47.1 pounds per capita in 2000 to 33.2 pounds per capita in 2016[14]. In comparison, a healthier counterpart, the sweet potato, has seen an increase from 4.2 pounds per capita in 2000 to 7.2 pounds per capita in 2016[15]. Similarly, in recent years rice has seen stagnant growth, fluctuating between slight growth and an overall decline. The consumption of rice in the United States has decreased from 4.09 million metric tons in 2008 to 3.81 million metric tons in 2017[16]. In comparison, a report by UN Comtrade, provided by Statista, shows that a healthier alternative, quinoa, has seen a huge increase in consumption levels. As the majority of quinoa production happens overseas, the import level of quinoa in the U.S has increased from 48.28 million pounds in the 2013 to 73.77 million pounds in 2017, a compounded growth rate of 11.7%.[17]
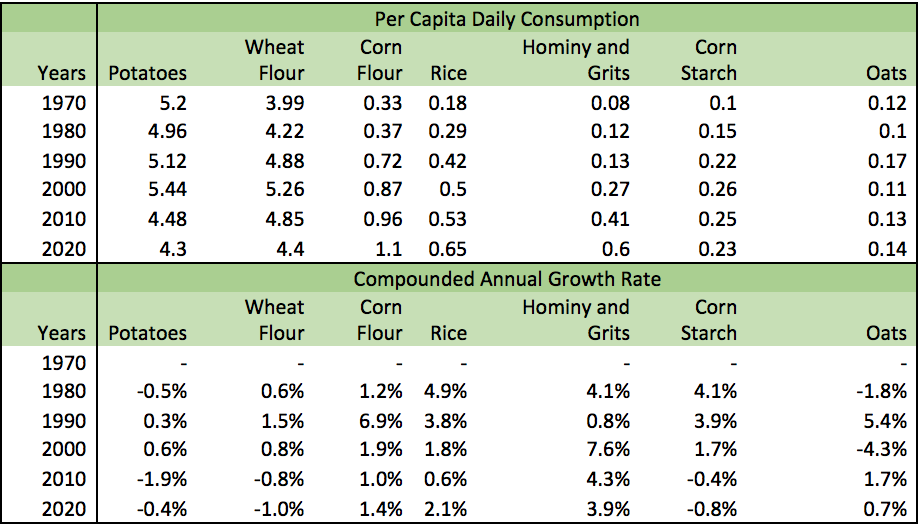
In our research, we found data on per capita consumption going back to 1970 through the Food Available Data System of the US Department of Agriculture. Per Capita Daily Consumption of potatoes, wheat flour, corn flour and rice all grew between 1970 and 2000 (although growth in the consumption of potatoes during that time period was uneven, and also minor on an absolute basis). While consumption of corn flour and rice continued to grow since 2000, consumption of potatoes and wheat flour has actually declined significantly, signaling a highly-notable shift. Consumers are now eating a more diversified set of staples than they did in past decades, and we expect this to continue. Indeed, it is intricately linked to the broader consumer mindset, which leads to trial, faster adoption of new products and the accelerating potential for existing categories to be disrupted. The following two tables show the data on changes in American grain consumption from 1970 till 2020 (projected) according to the US Department of Agriculture, provided by Nathan Yau[18], PhD at UCLA.
Change over Time in Daily Consumption
The splintering of traditional categories clearly creates opportunities, and BFY pasta makers are taking share from traditional pasta as well as creating a new category unto itself. This is reminiscent of the rise of quinoa where, as shown in the data, growth did not come solely as a replacement for rice or other grains. It has grown and taken share from a number of alternatives. We think that a similar expansion may be at hand for BFY pasta and expect continued growth of well over 10% for the category in the years to come in the United States as well as in key markets abroad.
The accelerating growth of plant-based protein.
Plant-Based Protein Growth Outpacing Meat and Dairy. Like grains, traditional milk and meat categories have both experienced disruption in the last ten years with overall sales flat or declining and emerging plant-based categories providing most, if not all, of the growth. Dairy milk sales have fallen 15% from 2012-2017, according to Mintel Research, equating to approximately $4.5 billion in inflation-adjusted retail sales. Non-dairy milks have not made up the entire drop off, but they have added approximately $1 billion in sales over that time frame. We see a similar situation in plant-based proteins where plant-based meat substitutes have grown quickly while the meat category has been growing only modestly – and shrinking in some key segments like pork and veal.
The trend among western consumers toward vegetarianism and flexitarianism is creating a meaningful shift in the purchasing of consumer staples. Many consumers are seeking to reduce lactose and meat for health reasons, ethical reasons and for undefined reasons, we call “trend-based.” People who reduce their meat and dairy intake often seek other sources of protein and plant-based, high protein products are ideal alternatives.
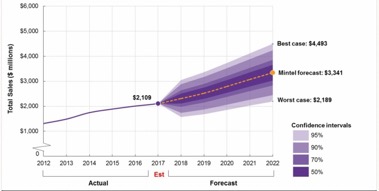
Non-Dairy Milk. Non-dairy milk, which includes refrigerated and shelf-stable almond milk, coconut milk, soy milk, and other varieties, is enjoying steady growth. According to market research firm Mintel[19], in 2017 the total sales of non-dairy milk in the U.S. grew at a 5.1% sales growth rate to $2.1 billion dollars. The growth of the non-dairy milk market in the U.S. is expected to increase at an accelerated pace of 9.6% CAGR and reach roughly $3.3 billion dollars by 2022. In the non-dairy milk market, almond milk is the strongest grower, with soy milk seeing a decline in growth rate. Strong growth in the category is due to a confluence of factors including the increasing awareness of lactose intolerance, change to healthy food diets, consumers dabbling in plant-based nutrition, and the fact that health-conscious millennials are becoming parents (spurring a greater sensitivity to health concerns). According to a survey by market research firm IRI[20], non-dairy milk is equivalent to 11.2% of the sales of the dairy industry. Research from Grand View Research [21]states that the global non-dairy milk market in 2017 is $3 billion dollars and is expected to grow to $5.2 billion dollars in 2022.
Total US non-dairy milk sales and forecast, at current prices, 2012-2022
Plant-based Protein. There is an increasing interest among consumers (particularly millennials) in plant-based proteins. According to Mintel[22], from purchase of all animal-based meats between 2015 and 2016 was actually down. In comparison, a report by Nielson[23] shows an 8.1% steady growth rate for plant-based meat alternatives in the U.S. According to a news report by Markets and Markets[24], the plant-based meat alternative U.S market in 2018 is currently valued at $4.6 billion dollars and forecasted to grow to $6.4 billion by 2023. Website Research and Markets[25] provides a report that states how currently, in 2018, the global market for plant-based proteins is valued at $7.5 billion dollars. As the number of millennials who are aware of the health benefits of protein-rich meat alternatives increases, the global market for plant-based proteins is projected to grow at a healthy CAGR of 7.2%, ending up being valued at $10.6 billion dollars by 2023. These trends also bode well for pasta that is lower in net carbs and higher in plant-based protein than traditional pasta products.
For further information, please contact the authors:
Stu Strumwasser Bakley Smith, CFA
Founder & Managing Director Vice President
Green Circle Capital Partners Green Circle Capital Partners
[email protected] [email protected]
Office: 646-875-4870 Office: 646-875-4870
© 2018, Green Circle Capital Partners LLC
This document is the property of Green Circle Capital Partners and for information only. It is not an offering for sale of any securities. This document may not be disclosed, distributed, or reproduced without the express, written permission of Green Circle Capital Partners LLC, New York, NY.
[1] https://www.statista.com /statistics/248867/market-sizes-of-pasta-categories-in-the-us/
[2] https://www.imarcgroup.com/pasta-market
[3] https://www.cnbc.com/2017/05/25/pasta-demand-chills-as-health-conscious-eating-trend-affects-sales-.html
[4] http://academic.mintel.com /display/794985/
[5] http://academic.mintel.com /display/794985/
[6] https://www.businesswire.com/news/home/20170420005585/en/Global-Gluten-Free-Food-Market-2017-2021-Marketing-Activities
[7] https://www.cnbc.com/2017/05/25/pasta-demand-chills-as-health-conscious-eating-trend-affects-sales-.html
[8] https://www-statista-com /statistics/721914/weekly-household-consumption-of-pasta-in-the-united-kingdom-uk/
[9] Washington Post “This is what happens when everyone is terrified of carbs”, https://www.washingtonpost.com/news/wonk/wp/2015/09/02/the-gluten-free-movement-is-ruining-the-worlds-love-for-one-of-its-favorite-foods/?noredirect=on&utm_term=.9b3862093d4d
[10] https://www.researchandmarkets.com/reports/4535040/pasta-market-global-industry-trends-share
[11] https://blog.euromonitor.com/2017/10/ranked-pasta-markets-value-volume.html
[12] https://blog.euromonitor.com/2017/10/ranked-pasta-markets-value-volume.html
[13] https://www.statista.com /statistics/189677/top-spaghetti-and-macaroni-and-pasta-brands-in-the-united-states/
[14] Statista, https://www.statista.com /statistics/381907/per-capita-consumption-of-fresh-potatoes-in-the-us/
[15] Statista, https://www.statista.com /statistics/257307/per-capita-consumption-of-fresh-sweet-potatoes-in-the-us/
[16] Statista, https://www.statista.com /statistics/255981/total-us-rice-consumption/
[17] Statista, https://www.statista.com/statistics/486411/us-quinoa-imports/
[18] https://flowingdata.com/2016/05/17/the-changing-american-diet/
[19] http://academic.mintel.com /display/794021/#
[20] https://www.statista.com /statistics/249077/share-of-us-milk-sales-by-category/
[21] https://www.statista.com /statistics/805314/dairy-alternatives-global-sales-value-by-category/
[22] http://academic.mintel.com /display/860227/
[23] https://www.foodnavigator-usa.com/Article/2017/09/13/US-plant-based-food-market-up-8.1-in-year-to-August-12
[24] http://www.onegreenplanet.org/news/meat-substitute-market-worth-billions/
[25] https://www.businesswire.com/news/home/20180122006357/en/Global-Plant-Protein-Market-2017-2023-Cargill-Archer